VC-Scope
Open-Source / Freeware
Graphing "Plug-In" for VCDS
(VC-Scope is included when you download VCDS)
- You can use VC-Scope in one of two ways:
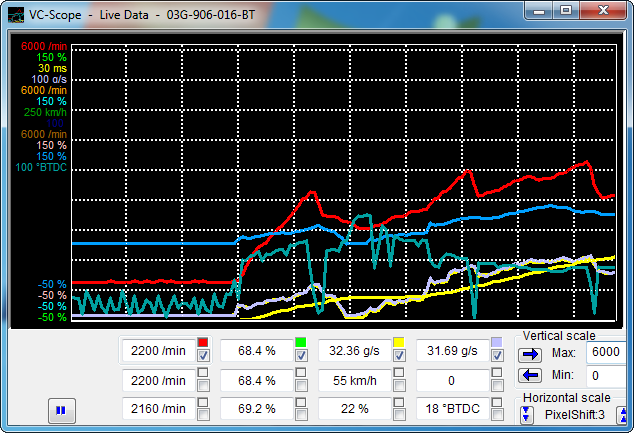
- View live data while connected to a car by launching VAG-Scope. Click the [Graph] button on VCDS's Measuring Blocks screen,
- View data previously logged with VCDS by manually starting VC-Scope in stand-alone and opening a VCDS Log file
- You cannot do both at the same time.If VC-Scope is running in Stand-alone mode, VCDS will not start. If you manually start VC-Scope while VCDS is running, it won't work (should give an error message).
- Use the checkboxes next to each display field to select which items are graphed.
- Click on a field to select it for vertical scaling.Then change the Max and Min values in the Vertical scale boxes. VC-Scope will remember all scaling values for a particular control module by part number.
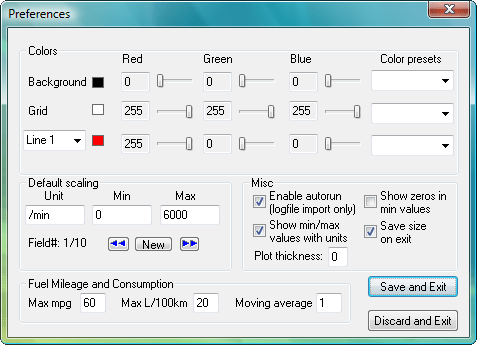
- Click the VC-Scope icon on the top left of the main VC-Scope screen for a menu item to access a Preferences Dialog:

Preferences: - Here you can set colors for the graph lines, the graph background and the grid.
- You can also set default scaling values (based on the units that VCDS sends)
Gauges:
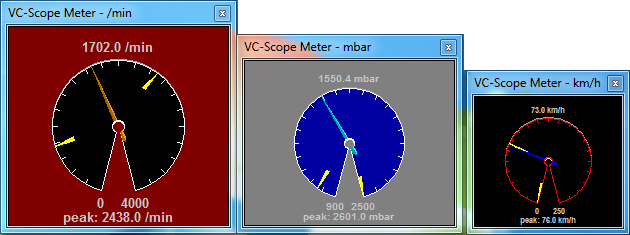
To display a gauge, right-click in the small color square next to the data you want to see on the gauge:

- You can have as many gauges as there are lines on the graph.
- Each gauge can be independently re-sized and repositioned.
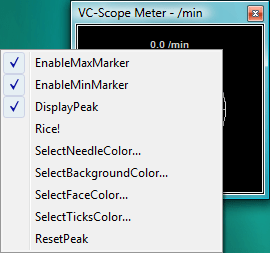
- Right-clicking on the gauge itself will give you several options:

Notes: - VAG-Scope can be used to play back Log files producedby any version of VCDS but only if they have not been saved or modified by any other program.
- VC-Scope is included in the all VCDS releases available on our Download Page, but you may find a newer version of VC-Scope on the VC-Scope Download Page.
Related links:


